


What were the key trends to emerge from the all-important festive trading period? OC&C’s Tom Gladstone looks at the numbers.
See the OC&C data in full here.
A merry online Christmas
Overall retail like-for-likes were broadly flat in Christmas 2015, continuing the trend of the previous three years. In aggregate over the entire period from 2011 to present, UK retail has benefited from less than 0.5% like-for-like growth, indicating how hard retailers are having to fight for shopper spend.
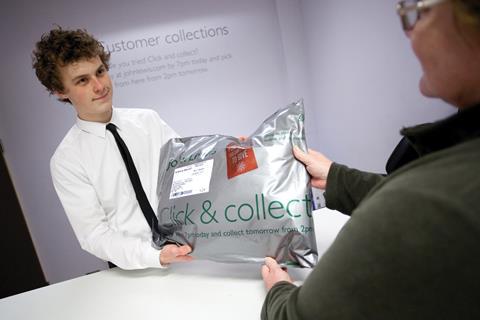
What growth there is continues to be captured online, which recorded another Christmas of double-digit growth – much of it driven by mobile.
Making mobile the centre of online strategy is likely to be critical to future success, particular in attracting the millennial generation.
The corollary of this was poor footfall, which was down 2% in aggregate across all location types (and retail parks the only locations with any footfall growth this year). Using click-and-collect as a route for driving footfall – and thinking carefully around how to drive impulse buys on collection may be necessary to buck this trend.
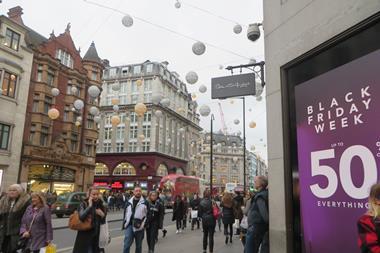
Black Friday hangover
With hindsight, the impact of Black Friday activity in 2014 became clear. Full-price Christmas sales were pulled forward into lower margin discounted sales, while shoppers were educated to look for deals in what had been a prime period.
This Christmas, many retailers tried to step back from the excesses of the previous year’s promotions, but the discounting genie is not proving easy to put back in the bottle.
Despite less activity, many retailers experienced a ‘three peaks’ trading pattern of sales spikes on Black Friday, Cyber Monday and Boxing Day – with sales flatlining in the fortnight before and after Black Friday.
And faster online growth versus the previous year’s level suggested it had accelerated the channel shift away from stores.
Retailers with strong propositions planning for this new trading rhythm and preparing other marketing activity to drive consumer interest in the run-up to Christmas seemed to have held on to prime trading and margin in the festive period (Fat Face’s charity giveaway on Black Friday a noticeable example).
But elsewhere there were heavy promotions in December to attract a price-savvy consumer.
A topic for 2016 will be whether seasonal trading rhythms have fundamentally shifted and require a new strategy.
Mild weather slows trading
The mildest December for more than 100 years had a more chilling effect on retailer sales, particularly in fashion where outerwear and winter clothing sales were depressed and significant discounting activity was needed to move product.
“Retailers will need to continue to build flexibility into supply chains, reduce lead times and increase open-to-buy levels to counter increasingly erratic weather”
Tom Gladstone, OC&C
With early autumn also being unseasonably warm, this was a tough quarter for the clothing sector and the full picture may only emerge when annual profit statements reveal what level of markdown needed to be invested.
Retailers will need to continue to build flexibility into supply chains, reduce lead times and increase open-to-buy levels to counter increasingly erratic weather.
Christmas winners
Christmas winners were in the same vein as in the previous couple of years; specialist retailers, premium propositions and distinctive fashion brands.
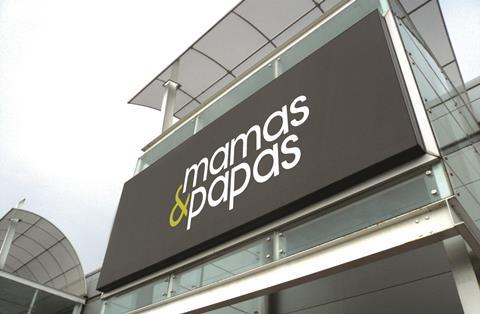
It was a much better Christmas in the baby sector than in previous years. Mamas & Papas topped the OC&C index and Mothercare’s like-for-likes were also up 4.2%.
White Stuff and Jigsaw performed best in fashion while Mountain Warehouse led a clutch of specialist retailers near the top of the index.
Department stores also continued their trend of winning through a multichannel offer, John Lewis, House of Fraser and Debenhams all reported strong overall trading.
Food fights
Of the big four grocers reporting Christmas like-for-likes, Tesco, Sainsbury’s and Morrisons all recorded a growth rate a little ahead of their performance the previous year, but the sector remains a tough place to play as Aldi and Lidl continue to put down more space driving double-digit overall sales growth.
Pricing deflation continues to run through the sector, 1.8% over the Christmas period according to Kantar Worldpanel.
The majority of this was driven by commodity deflation but compounded by the big four lowering everyday prices and simplifying promotions to respond to the discounter challenge.
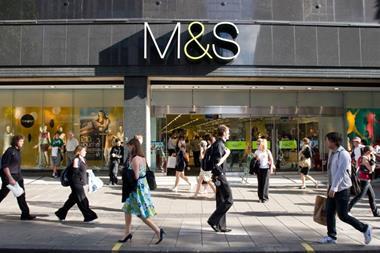
The big four continue to invest in points of difference against the discounters – be that customer service or premiumisation. In that environment, it was not an easy festive period for more premium grocers – Waitrose and Booths reported negative store like-for-likes and M&S was only marginally positive.
Expect 2016 to be equally challenging for the sector.
Predominantly store-based
| Retailer | % change in like-for-like sales 2015 | Weeks of period | Period end | % change in like-for-like sales 2014 | Movement 2015 on 14 |
|---|---|---|---|---|---|
| Mamas & Papas (retail)³ | 18.00% | 6 | 03-Jan | n/a | - |
| Fortnum & Mason | 15% | 5 | 03-Jan | 18.30% | ▼ |
| Mountain Warehouse | 15% | 6 | 03-Jan | 8.40% | ▲ |
| Jigsaw | 13% | 5 | 02-Jan | 10% | ▲ |
| White Stuff | 11% | 5 | 02-Jan | 6.50% | ▲ |
| JD Sports (Sports fashion fascias) | 10.60% | 5 | 02-Jan | 12.00% | ▼ |
| ScS | 9% | 25 | 16-Jan | n/a | - |
| Boux Avenue (UK) | 8% | 6 | 24-Dec | 32% | ▼ |
| The Fragrance Shop | 8% | 5 | 26-Dec | 5.00% | ▲ |
| Majestic Wine | 7% | 10 | 04-Jan | -2% | ▲ |
| Ernest Jones (Signet) | 7% | 8 | 26-Dec | 12% | ▼ |
| Superdrug¹ | 7% | 5 | 02-Jan | 7.40% | ▼ |
| Paperchase (products) | 6% | 5 | 27-Dec | 3.00% | ▲ |
| House of Fraser (stores and online) | 5.30% | 6 | 02-Jan | 8.00% | ▼ |
| John Lewis¹ | 5.10% | 6 | 02-Jan | 4.80% | ▲ |
| Dixons Carphone (UK and ROI)¹ | 5.00% | 10 | 09-Jan | 8.00% | ▼ |
| Homebase (Home Retail Group) | 5.00% | 18 | 02-Jan | 0.60% | ▲ |
| WHSmith (Travel) | 5% | 20 | 16-Jan | 2% | ▲ |
| The Entertainer | 5% | 5 | 02-Jan | 6% | ▼ |
| Foyles | 5% | 4 | 31-Dec | 8% | ▼ |
| Topps Tiles (UK) | 4.40% | 13 | 02-Jan | 6% | ▼ |
| Moss Bros | 4% | 23 | 09-Jan | n/a | - |
| Mothercare (UK) | 4.20% | 13 | 09-Jan | 1.10% | ▲ |
| Debenhams¹ | 4% | 7 | 09-Jan | 5% | ▼ |
| Fat Face | 3.00% | 5 | 02-Jan | 5% | ▼ |
| Blue Inc | 3.00% | 4 | 03-Jan | 3.00% | ▲ |
| Original Factory Shop¹ | 2.50% | 5 | 03-Jan | 3.30% | ▼ |
| Carpet Right³ | 2.40% | 12 | 23-Jan | n/a | - |
| Greggs¹ | 2.30% | 13 | 02-Jan | 8.20% | ▼ |
| Maplin Electronics¹ | 2.30% | 5 | 02-Jan | 3% | ▼ |
| Pets at Home¹ | 2.20% | 13 | 31-Dec | 4% | ▼ |
| H Samuel (Signet) | 1.60% | 8 | 26-Dec | 8.10% | ▼ |
| Tesco (UK)¹² | 1.30% | 6 | 09-Jan | -0.30% | ▲ |
| Supergroup (UK and Europe Retail) | 1.20% | 11 | 09-Jan | 12% | ▼ |
| Ryman | 0.70% | 6 | 24-Dec | 2.40% | ▼ |
| Marks & Spencer (Food) | 0.40% | 13 | 26-Dec | 0.10% | ▲ |
| Morrisons¹² | 0.20% | 9 | 03-Jan | -3.10% | ▲ |
| BRC average | 0.10% | 4 | 31-Dec | -0.40% | ▲ |
| Halfords (retail) | 0.00% | 15 | 15-Jan | 6.80% | ▼ |
| WHSmith (high street) | 0% | 20 | 16-Jan | -5% | ▲ |
| Sainsbury’s¹² | -0.40% | 15 | 09-Jan | -1.70% | ▲ |
| OC&C store weighted average | -0.30% | 0 | January | -0.40% | ▼ |
| McColl’s² | -0.70% | 6 | 10-Jan | -1% | ▲ |
| B&M Retail | -0.70% | 13 | 26-Dec | 4.50% | ▼ |
| Dunelm Group¹ | -0.80% | 13 | 02-Jan | 6.20% | ▼ |
| Waitrose (John Lewis Partnership)¹ | -1.40% | 6 | 02-Jan | 2.80% | ▼ |
| Booths¹ | -1.40% | 3 | 02-Jan | 0.80% | ▼ |
| Argos (Home Retail Group) | -2.20% | 18 | 02-Jan | 0.10% | ▼ |
| Marks & Spencer (all categories) | -2.50% | 13 | 26-Dec | -2.70% | ▲ |
| Robert Dyas | -2.50% | 6 | 24-Dec | 2.50% | ▼ |
| Bonmarché (stores) | -2.70% | 5 | 26-Dec | 3.90% | ▼ |
| Booker | -3.10% | 16 | 01-Jan | 2.50% | ▼ |
| Marks & Spencer (general merchandise) | -5.80% | 13 | 26-Dec | -5.80% | - |
Methodology: OC&C has used the shortest reported period of like-for-like sales during the Christmas period. Excludes results where the shortest reported period is greater than 26 weeks or less than 3 weeks. Periods vary significantly between retailers therefore care should be taken in interpreting the results. Definitions of like-for-like may vary between retailers but principally refer to same-store sales. Where possible figures relate to trading in UK / UK & Ireland. Figures are stated as reported - no decimal place indicates rounding at the reporting stage. Figures are for like-for-like growth in sales excluding VAT unless indicated otherwise.
Notes: 1. 2014 period length differs from 2013; 2. Excludes petrol; 3. No 2013 LfL available; 4. Like-for-like change in sales including VAT; 5. Company reported approximate figures; 6. Weighted by most recent reported annual revenue
Internet and direct
| Retailer | % change in like-for-like sales 2015 | Weeks of period | Period end | % change in like-for-like sales 2014 | Movement 2015 on 14 |
|---|---|---|---|---|---|
| Mountain Warehouse (online) | 49.20% | 6 | 03-Jan | 36% | ▲ |
| Superdrug (online) ³ | 47% | 5 | 02-Jan | n/a | - |
| Boohoo ³ | 45% | 17 | 31-Dec | n/a | - |
| Fat Face (online only) | 43% | 5 | 02-Jan | 25% | ▲ |
| Made.com ³ | 43% | 5 | 31-Dec | n/a | - |
| White Stuff (online) | 40.70% | 5 | 02-Jan | 38.10% | ▲ |
| The Entertainer (online) | 40% | 5 | 02-Jan | 60% | ▼ |
| Fortnum & Mason (online) | 38% | 5 | 03-Jan | 31% | ▲ |
| Jigsaw (online) ³ | 31% | 5 | 02-Jan | n/a | - |
| Asos (UK) ¹ | 25% | 17 | 31-Dec | 27% | ▼ |
| Ao World | 24% | 13 | 31-Dec | 26% | ▼ |
| Dunelm (home delivery) | 23% | 13 | 02-Jan | n/a | - |
| John Lewis (online) ¹ | 21% | 6 | 02-Jan | 19.00% | ▲ |
| Marks & Spencer (M&S.com) | 20.90% | 13 | 26-Dec | -5.90% | ▲ |
| OC&C Direct weighted average | 16.40% | 0 | January | 10.70% | ▼ |
| Debenhams (Online) ¹ | 15.40% | 7 | 09-Jan | 28.90% | ▼ |
| BRC average (online, non-food) | 15.10% | 4 | 31-Dec | 7.00% | ▲ |
| N Brown (online) ³ | 13% | 18 | 02-Jan | n/a | - |
| Virgin Wines | 12% | 6 | 02-Jan | n/a | - |
| IMRG Capgemini e-Retail Sales Index (Dec) | 12% | 8 | 26-Dec | 13% | ▼ |
| Mothercare (Mothercare.com) | 11.80% | 13 | 09-Jan | 16% | ▼ |
| Booths (online incl click-and-collect) | 11% | 3 | 02-Jan | n/a | - |
| Waitrose (online) ¹ | 7.90% | 6 | 02-Jan | 26.30% | ▼ |
| Shop Direct (group) | 6% | 7 | 25-Dec | 4% | ▲ |
| N Brown (group) ³ | 4.10% | 18 | 02-Jan | n/a | - |
| Bonmarché (online) | -2.40% | 5 | 26-Dec | 41.30% | ▼ |
Methodology: OC&C has used the shortest reported period of like-for-like sales during the Christmas period. Excludes results where the shortest reported period is greater than 26 weeks or less than 3 weeks. Periods vary significantly between retailers therefore care should be taken in interpreting the results. Definitions of like-for-like may vary between retailers but principally refer to same-store sales. Where possible figures relate to trading in UK / UK & Ireland. Figures are stated as reported - no decimal place indicates rounding at the reporting stage. Figures are for like-for-like growth in sales excluding VAT unless indicated otherwise.
Notes: 1. 1. 2014 period length differs from 2013; 2. Excludes petrol; 3. No 2013 LfL available; 4. Like-for-like change in sales including VAT; 5. Company reported approximate figures; 6. Weighted by most recent reported annual revenue
Topics
- Aldi
- Black Friday
- Booths
- BRC
- Christmas
- Debenhams
- Fat Face
- Financial results
- Footfall data
- Grocery
- House of Fraser
- Jigsaw
- John Lewis Partnership
- Lidl
- Mamas & Papas
- Market share data
- Marks & Spencer
- Morrisons
- Mothercare
- Mountain Warehouse
- Online retail & ecommerce
- Retail parks & out-of-town
- Sainsbury's
- Stores and property
- Tesco
- Waitrose & Partners
- White Stuff
- Worldpanel


No comments yet