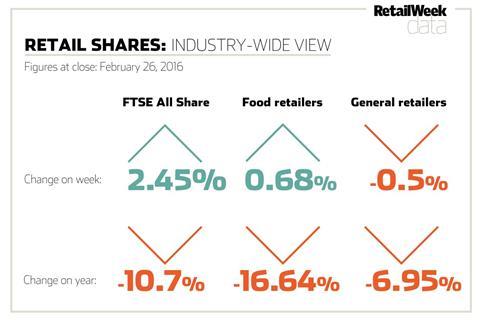
February 26, 2016: This week’s data on the biggest risers and fallers plus a comprehensive list of share price results in the retail sector.
Week’s biggest risers
| | Mkt Cap (£m) | Price (p) | Change on week (p) | Change on week (%) | 3-month change (%) | PE |
|---|
| Home Retail |
1,422.70 |
176.9 |
23.3 |
15.17 |
62.94 |
18.8 |
| Game Digital |
212.90 |
128.5 |
15.5 |
13.72 |
-38 |
9.85 |
| Darty |
611.60 |
115.25 |
9.25 |
8.73 |
16.67 |
53.98 |
| Ocado Group |
1,743.80 |
281.9 |
21.7 |
8.34 |
-26.08 |
- |
| McColl’s |
151.80 |
143.25 |
9 |
6.7 |
2.11 |
14.03 |
Week’s biggest fallers
| | Mkt Cap (£m) | Price (p) | Change on week (p) | Change on week (%) | 3-month change (%) | PE |
|---|
| Ao World |
670.70 |
158.8 |
-21.2 |
-11.78 |
-0.78 |
- |
| Moss Bros Group |
99.5 |
99 |
-4 |
-3.88 |
-2.96 |
24.62 |
| Signet Jewelers |
5,529.90 |
7015 |
-250 |
-3.44 |
-19.14 |
- |
| Dixons Carphone |
5,031.90 |
433.3 |
-15.1 |
-3.37 |
-8.52 |
46.5 |
| Next |
10,155.10 |
6770 |
-235 |
-3.35 |
-15.06 |
15.77 |
FTSE All Share companies
| | Mkt Cap (£m) | Price (p) | Change on week (p) | Change on week (%) | 3-month change (%) | PE |
|---|
| Tesco |
14,698.70 |
184.15 |
0.85 |
0.46 |
10.13 |
2.55 |
| Next |
10,155.10 |
6770 |
-235 |
-3.35 |
-15.06 |
15.77 |
| Kingfisher |
7,577.10 |
336.2 |
-5.9 |
-1.72 |
-5.29 |
13.86 |
| Marks & Spencer |
6,764.50 |
422.3 |
-10.1 |
-2.34 |
-16.77 |
14.18 |
| Signet Jewelers |
5,529.90 |
7015 |
-250 |
-3.44 |
-19.14 |
- |
| Burberry Group |
5,250.70 |
1269 |
-1 |
-0.08 |
-1.58 |
16.56 |
| Dixons Carphone |
5,031.90 |
433.30 |
-15.1 |
-3.37 |
-8.52 |
46.5 |
| J Sainsbury |
4,809.50 |
252.8 |
-8.3 |
-3.18 |
1.54 |
29.02 |
| Morrison Supermarket |
4,362.10 |
187.9 |
3 |
1.62 |
25.34 |
5.74 |
| B&M |
2,883.00 |
286.9 |
-4.1 |
-1.41 |
-6.41 |
84.4 |
| Sports Direct International |
2,390.30 |
397.4 |
-2.6 |
-0.65 |
-42.68 |
9.75 |
| JD Sports Fashion |
2,195.60 |
1133 |
17 |
1.52 |
11.9 |
32.24 |
| WHSmith |
2,096.20 |
1817 |
-1 |
-0.06 |
4.8 |
20.9 |
| Dunelm Group |
2,024.60 |
992.5 |
20 |
2.06 |
-0.35 |
20.87 |
| Ocado Group |
1,743.80 |
281.9 |
21.7 |
8.34 |
-26.08 |
- |
| Home Retail |
1,422.70 |
176.9 |
23.3 |
15.17 |
62.94 |
18.8 |
| Pets at Home Group |
1,348.00 |
271 |
9 |
3.44 |
-4.74 |
18.8 |
| Ted Baker |
1,304.20 |
2977 |
28 |
0.95 |
-15.09 |
36.33 |
| Card Factory |
1,172.00 |
341.5 |
0.5 |
0.15 |
-5.75 |
32.26 |
| SuperGroup |
1,069.80 |
1332 |
-18 |
-1.33 |
-20.33 |
23.77 |
| Debenhams |
935.5 |
78.35 |
-0.5 |
-0.63 |
-4.27 |
10.28 |
| N Brown Group |
927.4 |
331.7 |
11.7 |
3.66 |
-7.82 |
18.95 |
| Halfords |
764.6 |
399.1 |
16.4 |
4.29 |
1.67 |
11.85 |
| DFS Furniture |
677.2 |
321.7 |
1.9 |
0.59 |
-7.64 |
74.76 |
| Ao World |
670.7 |
158.8 |
-21.2 |
-11.78 |
-0.78 |
- |
| Darty |
611.6 |
115.25 |
9.25 |
8.73 |
16.67 |
53.98 |
| Poundland |
476.7 |
180.8 |
-0.6 |
-0.33 |
-21.22 |
15.89 |
| Mothercare |
339.9 |
200 |
4.75 |
2.43 |
-19.27 |
15.88 |
| Topps Tiles |
285.1 |
147 |
-0.5 |
-0.34 |
-2.98 |
21.77 |
| Carpetright |
231.1 |
340.5 |
-6.5 |
-1.87 |
-28.71 |
50.84 |
| Game Digital |
212.9 |
128.5 |
15.5 |
13.72 |
-38 |
9.85 |
| Laura Ashley |
180.1 |
24.5 |
0.25 |
1.03 |
-8.76 |
9.8 |
| Findel |
161.9 |
188 |
-0.75 |
-0.4 |
-16.87 |
6.33 |
| McColl’s |
151.8 |
143.25 |
9 |
6.7 |
2.11 |
14.03 |
| Moss Bros Group |
99.5 |
99 |
-4 |
-3.88 |
-2.96 |
24.62 |
| SCS Group |
74.4 |
180.5 |
8.5 |
4.94 |
1.09 |
32.51 |
| French Connection |
42.7 |
43.75 |
1.38 |
3.24 |
8.59 |
27.39 |
| Flying Brands |
0.5 |
1.5 |
- |
- |
-14.29 |
0.2 |
AIM-listed companies
| | Mkt Cap (£m) | Price (p) | Change on week (p) | Change on week (%) | 3-month change (%) | PE |
|---|
| Asos |
2,401.90 |
2941 |
222 |
8.16 |
-16.96 |
66.2 |
| Mulberry Group |
568.8 |
995 |
47 |
4.96 |
1.42 |
- |
| Boohoo.com |
460.5 |
41.25 |
0.25 |
0.61 |
15.49 |
55.04 |
| Conviviality |
325.9 |
217.75 |
2.75 |
1.28 |
-1.18 |
20.32 |
| Majestic Wine |
274.6 |
388.25 |
-7.25 |
-1.83 |
18.91 |
18.9 |
| Shoe Zone |
99.8 |
202.5 |
-10 |
-4.71 |
-4.32 |
12.48 |
| Bonmarché |
90.3 |
181.5 |
3 |
1.68 |
-41.11 |
8.75 |
| MySale |
67.2 |
44.5 |
-1.5 |
-3.26 |
-7.81 |
7.34 |
| United Carpets |
9.6 |
11.62 |
- |
- |
1.08 |
8.51 |
Source: PA Listings/FT Information


No comments yet