


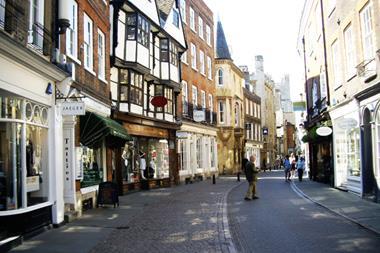
Cambridge has toppled a host of London locations to be named the best-quality retail location in the UK.
The city beat the likes of Westfield London, Knightsbridge, Chelsea and Bluewater to the top spot in the Harper Dennis Hobbs 2017 Vitality Index.
| Rank | Location | Vitality score | Market size (weighted retail expenditure) | Change since 2014 |
|---|---|---|---|---|
| 1 | Cambridge | 902 | £1,513,016,237 | 6 |
| 2 | Westfield London | 895 | £2,192,438,446 | -1 |
| 3 | Knightsbridge | 876 | £633,482,231 | 0 |
| 4 | Chelsea | 875 | £764,265,134 | -2 |
| 5 | Bluewater | 869 | £1,946,420,654 | 3 |
| 6 | Wimbledon Village | 863 | £88,843,941 | New entry |
| 7 | Richmond | 862 | £404,623,870 | 0 |
| 8 | Canary Wharf | 860 | £368,953,691 | -3 |
| 9 | Marlborough | 858 | £113,319,198 | New entry |
| 10 | Bath | 857 | £1,328,625,901 | 2 |
| 11 | Sloane Street | 855 | £206,106,322 | New entry |
| 12 | Westfield Stratford | 855 | £1,765,198,912 | 5 |
| 13 | Reigate | 853 | £131,328,606 | New entry |
| 14 | London West End | 850 | £9,141,226,044 | 2 |
| 15 | St Albans | 846 | £507,678,384 | 7 |
| 16 | Berkhamsted | 846 | £113,697,055 | New entry |
| 17 | Edinburgh | 845 | £2,346,843,910 | 5 |
| 18 | Kingston upon Thames | 842 | £2,107,118,547 | 0 |
| 19 | Cobham | 840 | £101,534,296 | New entry |
| 20 | Cribbs Causeway | 840 | £1,126,748,715 | 1 |
| 21 | Chiswick | 839 | £253,761,350 | 11 |
| 22 | Brighton | 839 | £1,902,344,776 | 6 |
| 23 | Harrogate | 838 | £826,855,386 | 3 |
| 24 | Guildford | 834 | £1,385,378,494 | -7 |
| 25 | Henley-on-Thames | 833 | £206,782,026 | New entry |
| 26 | Bristol – Clifton | 833 | £117,811,673 | New entry |
| 27 | Sherborne | 831 | £114,903,538 | New entry |
| 28 | Meadowhall | 827 | £1,741,402,629 | 4 |
| 29 | Ilkley | 826 | £174,778,586 | New entry |
| 30 | Sevenoaks | 826 | £193,322,362 | 8 |
| 31 | Chichester | 826 | £717,782,616 | 0 |
| 32 | Islington - Upper Street | 824 | £501,574,370 | -6 |
| 33 | Kensington | 823 | £685,114,699 | -14 |
| 34 | Birmingham | 822 | £3,738,666,154 | 31 |
| 35 | Leeds | 822 | £3,180,292,167 | 4 |
| 36 | Muswell Hill | 821 | £142,886,468 | New entry |
| 37 | Tenterden | 819 | £103,728,550 | New entry |
| 38 | Glasgow | 818 | £4,260,877,222 | 30 |
| 39 | Marlow | 814 | £174,047,714 | 7 |
| 40 | Fulham Road | 813 | £213,427,596 | New entry |
| 41 | Wilmslow | 813 | £197,659,173 | 2 |
| 42 | St Ives (Cornwall) | 813 | £97,121,316 | New entry |
| 43 | Chester | 812 | £1,678,594,102 | -4 |
| 44 | Hampstead | 811 | £89,398,650 | 1 |
| 45 | Trafford Centre | 810 | £1,851,676,699 | -12 |
| 46 | York | 810 | £1,396,532,968 | 4 |
| 47 | Liverpool | 810 | £3,102,829,857 | 0 |
| 48 | Oxford | 809 | £1,478,546,453 | -10 |
| 49 | Lakeside | 807 | £1,633,327,360 | -3 |
| 50 | Holborn | 807 | £171,628,390 | New entry |
The index sets out to measure the quality of retail locations by assessing factors such as the shop vacancy rate, how well the retail mix has been adapted to fit the needs of the local community and the proportion of ‘undesirable’ shops such as pawnbrokers and bookmakers.
After scoring each location based on those variables, Cambridge notched 902 out of a possible 1,000, edging out Westfield London – which came top of Harper Dennis Hobbs’ inaugural index three years ago – by just seven points.
Bluewater jumped three places to break into the top five, while new entry Wimbledon Village was a new entry in sixth place.
Expanded ranking
Wimbledon Village was one of 500 new locations to make the list after Harper Dennis Hobbs expanded the ranking to assess a total of 1,000 locations with more than 40 multiples, ranging from local high streets to regional shopping malls and major city centres.
Retail parks and outlet centres were excluded from the list, as their out of town locations mean that they are “not intrinsically linked to the local area,” Harper Dennis Hobbs said.
Although London destinations continue to dominate the upper echelons of the list, Marlborough and Bath broke into the top 10, while Birmingham (34th) and Glasgow (38th) were the most improved cities, rocketing 31 and 30 places respectively off the back of new retail developments.
Brent Cross plunged out of the top 50 as a result of the preparation for works to modernise and expand the centre, while Kensington slipped out of the top 20.
‘Undesirables’ and value stores
Harper Dennis Hobbs said other areas suffered due to an increase in the presence of “downmarket” stores.
The commercial estate agency said there had been a 2.7% increase in the proportion of value stores in centres of the past five years, in addition to a 1.6% increase in the proportion of “undesirable” shops.
Harper Dennis Hobbs head of retail consultancy, Jonathan De Mello, says: “This ranking highlights the ‘healthiest’ retail centres in Britain, which successful brands should target when considering network expansion.
“Smaller centres are of increasing interest to retailers, given rents are often highest in the largest centres. So a small centre with a high vitality score – and the right shopper profile – could potentially yield strong profits.”
Harper Dennis Hobbs executive director of retail, James Ebel, adds: “With an increase in online retailing, many of our clients, especially those from North America, now want to consider why they should enter a market rather than how many stores they should have.
“For this purpose, it’s important to know not only who trades in a retail centre, but how many are vacant and whether the market captures their customer profile.
“This ranking, with some bespoke criteria included, can be an important tool for retailers looking to expand their store portfolio.”
Methodology
The Harper Dennis Hobbs Vitality Index ranks all retail centres in Britain by quantifying the ‘retail health’ of each centre.
This year’s Index has been expanded from 500 locations to 1,000, measuring vitality through a number of variables: the proportion of up-market shops, the proportion of value-led shops, the vacancy rate and the proportion of ‘undesirable’ shops – such as pawnbrokers, money lenders, and bookmakers.
Greater scores are also given to areas whose retail mix has been adapted to the local community, while locations whose offer has deteriorated have been penalised.
- Check out Retail-week.com tomorrow for the bottom 50 retail centres in the UK.


No comments yet