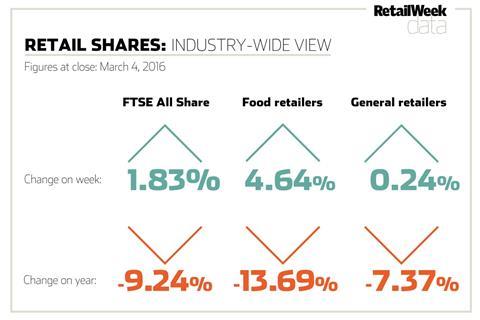
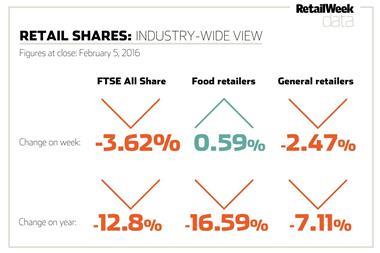
March 4, 2016: This week’s data on the biggest risers and fallers plus a comprehensive list of share price results in the retail sector.
Week’s biggest risers
| | Mkt Cap (£m) | Price (p) | Change on week (p) | Change on week (%) | 3-month change (%) | PE |
|---|
| Ao World |
789 |
189.3 |
30.5 |
19.21 |
15.74 |
- |
| Signet Jewelers |
6,283.00 |
7882 |
867 |
12.36 |
-2.26 |
- |
| Morrison Supermarket |
4,826.80 |
209 |
21.1 |
11.23 |
46.74 |
6.37 |
| Darty |
676.50 |
128 |
12.75 |
11.06 |
31.36 |
61.42 |
Week’s biggest fallers
| | Mkt Cap (£m) | Price (p) | Change on week (p) | Change on week (%) | 3-month change (%) | PE |
|---|
| Poundland |
444.70 |
168 |
-12.8 |
-7.08 |
-24.43 |
14.82 |
| Ocado Group |
1,548.00 |
268.3 |
-13.6 |
-4.82 |
-26.3 |
- |
| Topps Tiles |
273.4 |
140.5 |
-6.5 |
-4.42 |
-9.79 |
20.8 |
| WHSmith |
1,999.50 |
1754 |
-63 |
-3.47 |
1.57 |
20.15 |
| Mothercare |
329.8 |
193.5 |
-6.5 |
-3.25 |
-14.98 |
15.34 |
FTSE All Share companies
| | Mkt Cap (£m) | Price (p) | Change on week (p) | Change on week (%) | 3-month change (%) | PE |
|---|
| Tesco |
15,154.60 |
190.75 |
6.6 |
3.58 |
23.71 |
2.66 |
| Next |
10,064.70 |
6620 |
-150 |
-2.22 |
-10.93 |
15.46 |
| Kingfisher |
7,760.00 |
342.4 |
6.2 |
1.84 |
3.11 |
14.09 |
| Marks & Spencer |
6,951.20 |
424 |
1.7 |
0.4 |
-9.75 |
14.25 |
| Signet Jewelers |
6,283.00 |
7882 |
867 |
12.36 |
-2.26 |
- |
| Burberry Group |
6,069.90 |
1380 |
111 |
8.75 |
16.18 |
18.11 |
| J Sainsbury |
5,084.90 |
267.20 |
14.4 |
5.7 |
9.42 |
30.74 |
| Dixons Carphone |
5,019.20 |
436 |
2.7 |
0.62 |
-8.52 |
46.8 |
| Morrison Supermarket |
4,826.80 |
209 |
21.1 |
11.23 |
46.74 |
6.37 |
| B&M |
2,844.00 |
290.6 |
3.7 |
1.29 |
-1.52 |
85.39 |
| Sports Direct International |
2,453.70 |
407.2 |
9.8 |
2.47 |
-30.8 |
10.03 |
| JD Sports Fashion |
2,217.00 |
1152 |
19 |
1.68 |
10.69 |
32.77 |
| WHSmith |
1,999.50 |
1754 |
-63 |
-3.47 |
1.57 |
20.15 |
| Dunelm Group |
1,982.10 |
997 |
4.5 |
0.45 |
1.3 |
21.01 |
| Ocado Group |
1,548.00 |
268.3 |
-13.6 |
-4.82 |
-26.3 |
- |
| Home Retail |
1,464.20 |
179 |
2.1 |
1.19 |
69.81 |
18.99 |
| Pets at Home Group |
1,364.50 |
273.9 |
2.9 |
1.07 |
-1.12 |
19.06 |
| Ted Baker |
1,308.60 |
2956 |
-21 |
-0.71 |
-13.01 |
36.06 |
| Card Factory |
1,145.80 |
346.4 |
4.9 |
1.43 |
-8.1 |
32.66 |
| SuperGroup |
1,101.50 |
1350 |
18 |
1.35 |
-16.09 |
24.09 |
| N Brown Group |
969.9 |
359 |
27.3 |
8.23 |
5.31 |
20.45 |
| Debenhams |
965 |
78.6 |
0.25 |
0.32 |
0.64 |
10.31 |
| Halfords |
804.2 |
412.5 |
13.4 |
3.36 |
16.33 |
12.15 |
| Ao World |
789 |
189.3 |
30.5 |
19.21 |
15.74 |
- |
| DFS Furniture |
686.2 |
323.2 |
1.5 |
0.47 |
-3.85 |
75.18 |
| Darty |
676.5 |
128 |
12.75 |
11.06 |
31.36 |
61.42 |
| Poundland |
444.7 |
168 |
-12.8 |
-7.08 |
-24.43 |
14.82 |
| Mothercare |
329.8 |
193.5 |
-6.5 |
-3.25 |
-14.98 |
15.34 |
| Topps Tiles |
273.4 |
140.5 |
-6.5 |
-4.42 |
-9.79 |
20.8 |
| Carpetright |
247.9 |
362.75 |
22.25 |
6.53 |
-23.24 |
54.16 |
| Game Digital |
224.4 |
135 |
6.5 |
5.06 |
-31.96 |
10.43 |
| Laura Ashley |
171 |
24 |
-0.5 |
-2.04 |
-13.76 |
9.6 |
| Findel |
167.9 |
191.5 |
3.5 |
1.86 |
-0.38 |
6.41 |
| McColl’s |
152.9 |
141.5 |
-1.75 |
-1.22 |
4.19 |
9.21 |
| Moss Bros Group |
104.2 |
102 |
3 |
3.03 |
2.23 |
25.39 |
| SCS Group |
72.4 |
187 |
6.5 |
3.6 |
6.78 |
33.68 |
| French Connection |
41.8 |
43.75 |
- |
- |
7.41 |
27.26 |
| Flying Brands |
0.5 |
1.5 |
- |
- |
-7.69 |
0.2 |
AIM-listed companies
| | Mkt Cap (£m) | Price (p) | Change on week (p) | Change on week (%) | 3-month change (%) | PE |
|---|
| Asos |
2,547.90 |
3048 |
107 |
3.64 |
-8.7 |
68.66 |
| Mulberry Group |
592.2 |
986.5 |
-8.5 |
-0.85 |
6.27 |
- |
| Boohoo.com |
469 |
43.25 |
2 |
4.85 |
21.9 |
57.7 |
| Conviviality |
338.4 |
213.25 |
-4.5 |
-2.07 |
0.23 |
19.96 |
| Majestic Wine |
308.7 |
388.25 |
- |
- |
33.9 |
18.95 |
| Shoe Zone |
101.2 |
202.5 |
- |
- |
-2.88 |
12.5 |
| Bonmarché |
90.8 |
181.5 |
- |
- |
-40.49 |
8.8 |
| MySale |
67 |
43.5 |
-1 |
-2.25 |
-6.35 |
7.08 |
| United Carpets |
9.5 |
11.62 |
- |
- |
3.3 |
8.41 |
Source: PA Listings/FT Information


No comments yet