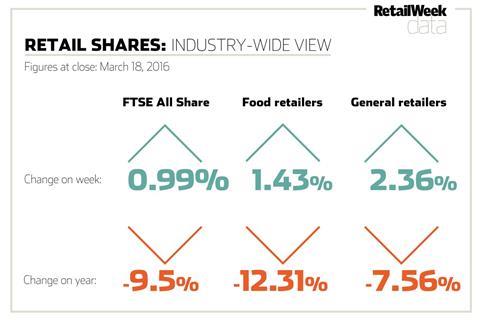
March 18, 2016: This week’s data on the biggest risers and fallers plus a comprehensive list of share price results in the retail sector.
Week’s biggest risers
| | Mkt Cap (£m) | Price (p) | Change on week (p) | Change on week (%) | 3-month change (%) | PE |
|---|
| Ocado Group |
1,863.30 |
297.5 |
38.8 |
15 |
-12.56 |
- |
| SuperGroup |
1,207.10 |
1483 |
154 |
11.59 |
-9.56 |
26.45 |
| Sports Direct International |
2,402.80 |
425.1 |
34.8 |
8.92 |
-28.88 |
10.48 |
| McColl’s |
165.40 |
163.25 |
12.25 |
8.11 |
17.91 |
10.64 |
| Topps Tiles |
296.80 |
153 |
10.5 |
7.37 |
-2.09 |
22.67 |
Week’s biggest fallers
| | Mkt Cap (£m) | Price (p) | Change on week (p) | Change on week (%) | 3-month change (%) | PE |
|---|
| Home Retail |
1,474.00 |
163.2 |
-16.1 |
-8.98 |
79.1 |
17.38 |
| Moss Bros Group |
101 |
100 |
-6 |
-5.66 |
-1.48 |
24.9 |
| Ao World |
703.6 |
170.9 |
-9.1 |
-5.06 |
4.38 |
- |
| Debenhams |
936.10 |
75.8 |
-1.5 |
-1.94 |
2.9 |
9.94 |
| Burberry Group |
5,945.30 |
1354 |
-24 |
-1.74 |
10.5 |
17.74 |
FTSE All Share companies
| | Mkt Cap (£m) | Price (p) | Change on week (p) | Change on week (%) | 3-month change (%) | PE |
|---|
| Tesco |
15,708.20 |
194.85 |
2.65 |
1.38 |
27.9 |
2.73 |
| Next |
9,981.90 |
6635 |
70 |
1.07 |
-7.73 |
15.52 |
| Kingfisher |
8,106.70 |
352.6 |
10.3 |
3.01 |
7.83 |
14.48 |
| Marks & Spencer |
6,665.60 |
417.3 |
19.2 |
4.82 |
-9.41 |
14.02 |
| Burberry Group |
5,945.30 |
1354 |
-24 |
-1.74 |
10.5 |
17.74 |
| J Sainsbury |
5,416.80 |
273.2 |
-0.1 |
-0.04 |
5.67 |
31.44 |
| Dixons Carphone |
5,005.40 |
441.00 |
17.4 |
4.11 |
-12.65 |
47.27 |
| Morrison Supermarket |
4,740.40 |
201.2 |
2.4 |
1.21 |
30.97 |
21.11 |
| B&M |
2,720.00 |
274 |
5.7 |
2.12 |
-3.24 |
80.59 |
| Sports Direct International |
2,402.80 |
425.1 |
34.8 |
8.92 |
-28.88 |
10.48 |
| JD Sports Fashion |
2,238.40 |
1129 |
-9 |
-0.79 |
13.64 |
32.1 |
| WHSmith |
2,101.10 |
1809 |
30 |
1.69 |
4.97 |
20.76 |
| Dunelm Group |
1,960.30 |
937.5 |
7.5 |
0.81 |
1.58 |
19.78 |
| Ocado Group |
1,863.30 |
297.5 |
38.8 |
15 |
-12.56 |
- |
| Home Retail |
1,474.00 |
163.2 |
-16.1 |
-8.98 |
79.1 |
17.38 |
| Pets at Home Group |
1,416.00 |
285 |
17 |
6.34 |
4.02 |
19.82 |
| Ted Baker |
1,288.80 |
2891 |
101 |
3.62 |
-2.17 |
28.7 |
| SuperGroup |
1,207.10 |
1483 |
154 |
11.59 |
-9.56 |
26.45 |
| Card Factory |
1,149.50 |
343.5 |
8 |
2.38 |
-6.61 |
32.37 |
| N Brown Group |
1,026.30 |
360 |
10.4 |
2.97 |
15.99 |
20.49 |
| Debenhams |
936.1 |
75.8 |
-1.5 |
-1.94 |
2.9 |
9.94 |
| Halfords |
826.1 |
423.5 |
21.2 |
5.27 |
23.66 |
12.55 |
| Ao World |
703.6 |
170.9 |
-9.1 |
-5.06 |
4.38 |
- |
| Darty |
692.4 |
130 |
- |
- |
28.82 |
61.64 |
| DFS Furniture |
673.6 |
325 |
10 |
3.17 |
-5.39 |
75.53 |
| Poundland |
458.4 |
173.2 |
10.1 |
6.19 |
-18.85 |
15.24 |
| Mothercare |
308 |
189.25 |
3 |
1.61 |
-18.07 |
15.01 |
| Topps Tiles |
296.8 |
153 |
10.5 |
7.37 |
-2.09 |
22.67 |
| Carpetright |
227.6 |
338.25 |
17.25 |
5.37 |
-31.28 |
50.49 |
| Game Digital |
221 |
131 |
- |
- |
1.96 |
10.08 |
| Laura Ashley |
174.7 |
24.5 |
- |
- |
-11.11 |
9.8 |
| McColl’s |
165.4 |
163.25 |
12.25 |
8.11 |
17.91 |
10.64 |
| Findel |
161.4 |
186.25 |
-3.25 |
-1.72 |
-8.68 |
6.28 |
| Moss Bros Group |
101 |
100 |
-6 |
-5.66 |
-1.48 |
24.9 |
| SCS Group |
76 |
190 |
8 |
4.4 |
14.46 |
34.2 |
| French Connection |
46 |
45 |
1.5 |
3.45 |
29.05 |
12.82 |
| Flying Brands |
0.5 |
1.5 |
- |
- |
-7.69 |
0.2 |
AIM-listed companies
| | Mkt Cap (£m) | Price (p) | Change on week (p) | Change on week (%) | 3-month change (%) | PE |
|---|
| Asos |
2,551.30 |
3083 |
-49 |
-1.56 |
-6.31 |
69.46 |
| Mulberry Group |
592.3 |
974 |
-13 |
-1.32 |
6.41 |
- |
| Boohoo.com |
466.2 |
42.5 |
2.25 |
5.59 |
16.08 |
56.63 |
| Conviviality |
361.3 |
230.25 |
8.25 |
3.72 |
5.92 |
21.57 |
| Majestic Wine |
302 |
388.25 |
- |
- |
42.33 |
18.91 |
| Shoe Zone |
104.8 |
209.5 |
12 |
6.08 |
4.75 |
12.9 |
| Bonmarché |
90.8 |
181.5 |
- |
- |
-1.63 |
8.8 |
| MySale |
64.7 |
43 |
-1 |
-2.27 |
-5.52 |
6.94 |
| United Carpets |
9.5 |
11.62 |
- |
- |
-4.08 |
8.41 |
Source: PA Listings/FT Information


No comments yet