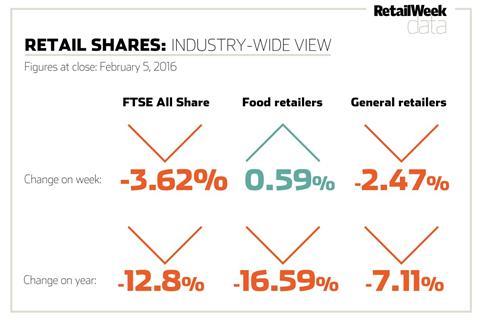
February 5, 2016: This week’s data on the biggest risers and fallers plus a comprehensive list of share price results in the retail sector.
Week’s biggest risers
| | Mkt Cap (£m) | Price (p) | Change on week (p) | Change on week (%) | 3-month change (%) | PE |
|---|
| Home Retail |
1,220.20 |
151.9 |
15.2 |
11.12 |
50.3 |
16.2 |
| Topps Tiles |
279.70 |
143.75 |
8 |
5.89 |
-0.52 |
21.3 |
| Ao World |
673.70 |
160 |
8 |
5.26 |
2.37 |
- |
| J Sainsbury |
4,715.20 |
250.9 |
5.8 |
2.37 |
0.82 |
28.88 |
| Poundland |
382.10 |
145.2 |
3.3 |
2.33 |
-47.84 |
12.76 |
Week’s biggest fallers
| | Mkt Cap (£m) | Price (p) | Change on week (p) | Change on week (%) | 3-month change (%) | PE |
|---|
| Signet Jewelers |
6,010.20 |
7178 |
-756 |
-9.53 |
-19.96 |
- |
| Mothercare |
322.8 |
190 |
-19.5 |
-9.31 |
-18.36 |
15.08 |
| Dixons Carphone |
5,166.60 |
440.1 |
-33.6 |
-7.09 |
-2.28 |
47.17 |
| Sports Direct International |
2,389.10 |
394 |
-21.6 |
-5.2 |
-41.84 |
9.67 |
| Dunelm Group |
1,737.70 |
834.5 |
-41.5 |
-4.74 |
-8.83 |
17.53 |
FTSE All Share companies
| | Mkt Cap (£m) | Price (p) | Change on week (p) | Change on week (%) | 3-month change (%) | PE |
|---|
| Tesco |
13,831.70 |
174.6 |
1.2 |
0.69 |
-0.99 |
2.46 |
| Next |
10,042.10 |
6620 |
-305 |
-4.4 |
-14.61 |
15.49 |
| Kingfisher |
7,324.00 |
323.5 |
-2.6 |
-0.8 |
-9.46 |
13.37 |
| Marks & Spencer |
6,756.60 |
415.3 |
-8.8 |
-2.07 |
-19.24 |
13.99 |
| Signet Jewelers |
6,010.20 |
7178 |
-756 |
-9.53 |
-19.96 |
- |
| Burberry Group |
5,273.00 |
1218 |
23 |
1.92 |
-9.75 |
15.93 |
| Dixons Carphone |
5,166.60 |
440.10 |
-33.6 |
-7.09 |
-2.28 |
47.17 |
| J Sainsbury |
4,715.20 |
250.9 |
5.8 |
2.37 |
0.82 |
28.88 |
| Morrison Supermarket |
3,983.80 |
175 |
0.5 |
0.29 |
10.07 |
5.34 |
| B&M |
2,878.00 |
285 |
4 |
1.42 |
-13.74 |
83.79 |
| Sports Direct International |
2,389.10 |
394 |
-21.6 |
-5.2 |
-41.84 |
9.67 |
| JD Sports Fashion |
2,193.70 |
1107 |
-37 |
-3.23 |
18.07 |
31.43 |
| WHSmith |
2,072.10 |
1775 |
-67 |
-3.64 |
9.57 |
20.41 |
| Dunelm Group |
1,737.70 |
834.5 |
-41.5 |
-4.74 |
-8.83 |
17.53 |
| Ocado Group |
1,532.40 |
259 |
-5.1 |
-1.93 |
-33.53 |
- |
| Ted Baker |
1,334.50 |
3013 |
4 |
0.13 |
-10.97 |
36.73 |
| Pets at Home Group |
1,315.00 |
260.5 |
3.5 |
1.36 |
-3.59 |
18.13 |
| Home Retail |
1,220.20 |
151.9 |
15.2 |
11.12 |
50.3 |
16.2 |
| SuperGroup |
1,194.10 |
1447 |
-24 |
-1.63 |
-8.7 |
25.79 |
| Card Factory |
1,166.50 |
336.7 |
-12.2 |
-3.5 |
-6.04 |
31.75 |
| Debenhams |
964.3 |
78.45 |
0.05 |
0.06 |
-6.94 |
10.29 |
| N Brown Group |
883.5 |
317.6 |
7 |
2.25 |
-11.89 |
18.13 |
| Halfords |
756.6 |
385.5 |
6.4 |
1.69 |
-3.8 |
11.36 |
| Ao World |
673.7 |
160 |
8 |
5.26 |
2.37 |
- |
| DFS Furniture |
667 |
308 |
-7 |
-2.22 |
-6.57 |
71.64 |
| Darty |
529.5 |
100 |
-1.5 |
-1.48 |
-6.32 |
48.3 |
| Poundland |
382.1 |
145.2 |
3.3 |
2.33 |
-47.84 |
12.76 |
| Mothercare |
322.8 |
190 |
-19.5 |
-9.31 |
-18.36 |
15.08 |
| Topps Tiles |
279.7 |
143.75 |
8 |
5.89 |
-0.52 |
21.3 |
| Carpetright |
261.5 |
374.5 |
-18.25 |
-4.65 |
-18.17 |
55.93 |
| Laura Ashley |
187.4 |
25.5 |
0.25 |
0.99 |
-8.04 |
10.2 |
| Game Digital |
175.9 |
104 |
-0.75 |
-0.72 |
-57.23 |
8.04 |
| Findel |
169.6 |
199.5 |
4.5 |
2.31 |
-17.97 |
6.71 |
| McColl’s |
146.6 |
138.25 |
-0.5 |
-0.36 |
-4.11 |
13.53 |
| Moss Bros Group |
103 |
100 |
1.25 |
1.27 |
5.15 |
24.9 |
| SCS Group |
69.2 |
175.62 |
-4.38 |
-2.43 |
-4.95 |
31.57 |
| French Connection |
41 |
45.75 |
1 |
2.23 |
23.91 |
28.47 |
| Flying Brands |
0.5 |
1.5 |
- |
- |
-25 |
0.2 |
AIM-listed companies
| | Mkt Cap (£m) | Price (p) | Change on week (p) | Change on week (%) | 3-month change (%) | PE |
|---|
| Asos |
2,425.30 |
2774 |
-331 |
-10.66 |
-12.62 |
62.5 |
| Mulberry Group |
584.4 |
949.5 |
-15.5 |
-1.61 |
7.12 |
- |
| Boohoo.com |
494.2 |
44 |
4 |
10 |
21.38 |
58.7 |
| Conviviality |
318.2 |
205 |
5 |
2.5 |
2.5 |
19.2 |
| Majestic Wine |
267.2 |
390.75 |
33.75 |
9.45 |
19.92 |
19.03 |
| Shoe Zone |
103.2 |
206.5 |
-5 |
-2.36 |
-3.5 |
12.7 |
| Bonmarché |
89.3 |
178.5 |
- |
- |
-43.6 |
8.6 |
| MySale |
67.7 |
44.25 |
-4 |
-8.29 |
-15.17 |
7.52 |
| United Carpets |
9.5 |
11.62 |
-0.25 |
-2.11 |
- |
8.41 |
Source: PA Listings/FT Information


No comments yet