

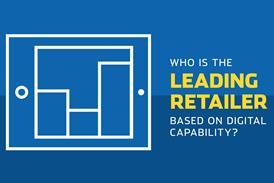


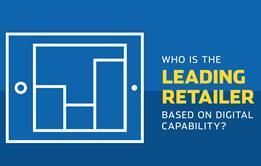
Retail Week Indicator has reviewed retailers’ digital capability through a strategic audit, across all areas of a customer’s digital shopping journey.
Digital capability was assessed across four performance categories – marketing, logistics and customer service, cross-channel and ecommerce. All retailers were scored against each performance category as well as their financial performance. The category scores were aggregated to create an overall score per retailer.
The table below shows where home and DIY retailers in the UK are positioned and why.
For the best viewing experience of the table, click on the full screen view button if shown:
| Position | Retailer | Marketing (%) | Logistics & Customer service (%) | Cross-channel (%) | Ecommerce (%) | Total (%) |
|---|---|---|---|---|---|---|
| 1 | Screwfix | 30.7 | 46.6 | 55.0 | 61.4 | 56.3 |
| 2 | B&Q | 70.7 | 40.5 | 52.0 | 48.5 | 48.1 |
| 3 | Ikea | 59.3 | 34.1 | 50.2 | 44.9 | 47.3 |
| 4 | Bathstore.com | 33.3 | 47.2 | 44.3 | 47.0 | 47.1 |
| 5 | Wickes | 44.0 | 58.4 | 26.3 | 38.2 | 40.6 |
| 6 | Dreams | 33.3 | 34.6 | 31.8 | 40.0 | 40.0 |
| 7 | Made.com | 50.7 | 21.2 | 23.5 | 50.1 | 39.3 |
| 8 | Lakeland | 38.7 | 38.0 | 35.2 | 51.2 | 38.5 |
| 9 | Amara | 40.0 | 48.3 | 9.2 | 45.5 | 37.3 |
| 10 | Dunelm | 44.0 | 37.7 | 37.0 | 38.0 | 36.6 |
| 11 | Better Bathrooms | 38.7 | 41.3 | 12.2 | 46.3 | 36.4 |
| 12 | Sofology | 41.3 | 46.9 | 30.6 | 35.0 | 35.7 |
| 13 | DFS | 49.3 | 39.1 | 35.8 | 36.3 | 34.9 |
| 14 | Topps Tiles | 30.7 | 46.4 | 35.8 | 38.6 | 34.3 |
| 15 | The White Company | 46.7 | 34.6 | 17.7 | 32.1 | 34.3 |
| 16 | Furniture Village | 36.0 | 32.4 | 26.9 | 41.3 | 33.3 |
| 17 | Victorian Plumbing | 24.0 | 39.4 | 14.1 | 39.3 | 33.3 |
| 19 | ScS | 37.3 | 33.8 | 17.1 | 35.0 | 32.3 |
| 20 | Houseology | 37.3 | 33.0 | 1.2 | 43.8 | 31.6 |
| 21 | Homebase | 37.3 | 22.3 | 31.5 | 32.7 | 31.4 |
| 22 | The Range | 52.0 | 17.0 | 19.0 | 31.2 | 31.3 |
| 23 | Oak Furniture Land | 25.3 | 25.4 | 13.5 | 40.4 | 31.0 |
| 24 | Robert Dyas | 37.3 | 31.0 | 17.7 | 37.4 | 30.4 |
| 25 | Victoria Plum | 26.7 | 46.6 | 3.7 | 41.6 | 30.1 |
| 26 | Laura Ashley | 54.7 | 35.2 | 22.0 | 32.8 | 30.1 |
| 27 | Loaf | 25.3 | 31.8 | 14.7 | 27.6 | 29.2 |
| 28 | Cath Kidston | 36.0 | 17.9 | 21.4 | 30.9 | 25.2 |
| 29 | Eve Sleep | 17.3 | 48.0 | 9.2 | 26.1 | 24.8 |
| 30 | Carpetright | 48.0 | 17.0 | 26.3 | 30.4 | 24.5 |
| 31 | Sofa.com | 22.7 | 28.5 | 19.0 | 28.0 | 23.9 |
| 32 | Brighthouse | 26.7 | 29.9 | 6.1 | 21.0 | 16.6 |
| 33 | Tapi | 20.5 | 16.8 | 6.1 | 9.8 | 9.7 |
Read the full analysis of the home & DIY sector here
To understand how Retail Week measured retailers’ digital capabilities, please read the full methodology.
Retail Week Indicator 2018 rankings
Retail Week Indicator has reviewed retailers’ digital capability through a strategic audit, across all areas of a customer’s digital shopping journey. Discover where the leading 180 retailers in the UK are positioned.
- 1
- 2
- 3
- 4
- 5
- 6
- 7
- 8
- 9
- 10
- 11
- 12
- 13
- 14
- 15
- 16
- 17
- 18
- 19
- 20
- 21
 Currently
reading
Currently
reading
Retail Week Indicator 2018: Home and DIY ranking
- 23
- 24
- 25
- 26


